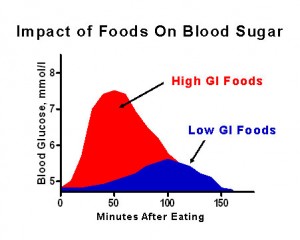
 The glycemic index (GI) is a ranking of carbohydrates on a scale from 0 to 100 according to the extent to which they raise blood sugar levels after eating. By definition, glucose is given a value of 100 – and in the charts below, you’ll find the values for anything from cereals, bread, vegetables, to fruits.
For example, foods with a high GI are those which are rapidly digested and absorbed and result in marked increases in blood sugar levels (shown in red in the graph above). On the other hand, low GI foods (shown in blue) produce only slow rises in blood sugar and insulin levels due to their slow digestion and absorption into the blood stream.
Clinically, low glycemic index diets have been shown to improve both glucose and lipid levels in people with diabetes (type 1 and type 2) – but beyond that, swapping out high glycemic foods from your diet is also a key prerequisite to optimizing weight loss.
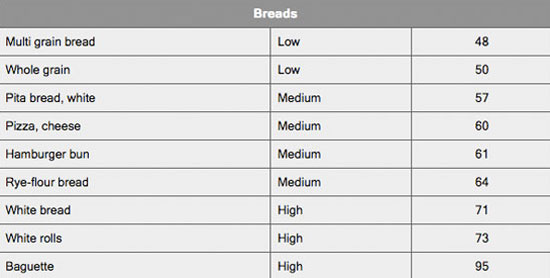
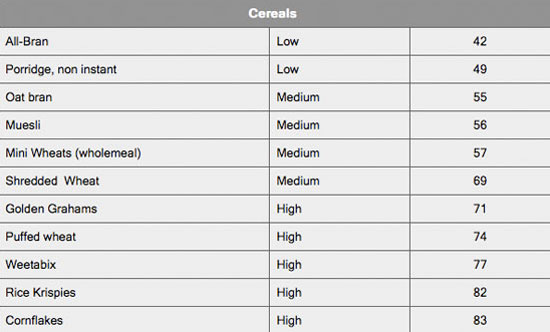
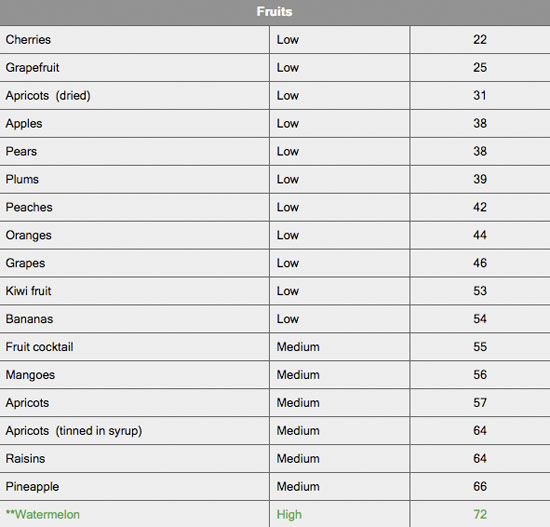
Glycemic Index Food Charts
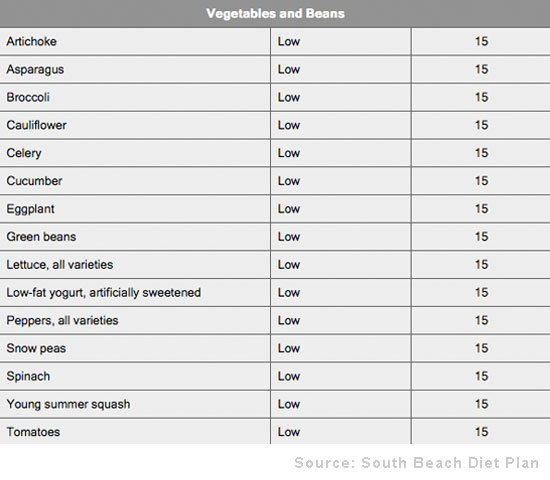
So to help you make smarter choices, I’ve pulled out a number of food charts listing the glycemic index for bread, cereals, fruits and vegetables.
One thing to note is that the glycemic index is not an exact measure – for example for a fruit, it can depend on the level of ripeness or where it’s grown. Rather, you should take the glycemic index numbers as a general guide so you can make smart swaps. For example, a lot of the vegetables have very low glycemic indices – most of them are high in fiber and thus slow absorption of any carbohydrates.


 Are you ready to look better, feel more energized, and get back that youthful feeling you remember having as a kid? I can help you on a journey that will change the way you eat — for good. My





 As a healthy cooking expert, health coach and TV host,


This is useful info. I am trying to find GI charts for a more comprehensive list.
How does the glycemic index of a fruit influence the blood sugar of a person?